
What is a good ROAS? Start from break-even, not an average
ROAS (return on ad spend) is the revenue credited to your ads divided by what the ads cost. Spend $1,000, get credited with $3,000 in sales, and your ROAS is 3x, or 300%. That’s the whole calculation. The trouble starts when someone asks whether 3x is any good.
A benchmark can’t answer that, because it averages businesses with very different margins. What is a good ROAS for you depends on how much of each sale is left once the product is paid for, and that’s your margin.
Here’s the rule. Break-even ROAS is 1 divided by your margin, written as a decimal. If you keep 40 cents of every sales dollar after the cost of the goods, your break-even ROAS is 1 ÷ 0.40 = 2.5x. Below 2.5x, the orders the ads bring in contribute less than the ads cost. At exactly 2.5x, the ads pay for themselves and nothing more.
Check it in dollars. Spend $1,000 at 2.5x and you’re credited with $2,500 in revenue. A 40% margin on $2,500 is $1,000, which is exactly the ad spend. Nothing left over.
A thin-margin store needs a far higher ROAS than a high-margin one just to stand still. One ‘good ROAS’ number can’t serve both.
Adjust the margin for the costs gross margin leaves out
Gross margin usually subtracts only the cost of the product. Your ads pay for orders, though, and every order carries more costs than the item in the box. Put gross margin into the formula and break-even comes out too low, so campaigns that are losing money look fine.
Work it per order. Say a homeware store’s average order is $80 and the products in it cost $40. Gross margin is 50%, so the naive break-even is 2.0x. Now follow the order out of the door:
- Payment processing: say 3% of the order, or $2.40.
- Shipping you absorb: ‘free shipping’ that actually costs you $6 a parcel.
- Packaging and packing time: $1.60.
- Returns and refunds: refunded orders, unsellable stock and return postage, averaged across all orders, say $4 an order.
- Discounts: nothing in this example, but a promo code that isn’t already deducted from the revenue figure comes straight off the margin.
That leaves $80 − $40 − $2.40 − $6 − $1.60 − $4 = $26 an order, a 32.5% contribution margin. Break-even moves from 2.0x to 1 ÷ 0.325, about 3.1x. A campaign reporting 2.6x looked comfortably profitable on gross margin. On contribution margin, each ad dollar brings back $2.60 of revenue and about 85 cents of contribution, so it loses roughly 15 cents.
One more check before you trust the answer: find out what the ad platform is actually sent as revenue. Some stores pass the order total including tax and the shipping charged to the customer; others pass the product subtotal. Your margin has to be worked out on the same base, or the comparison is wrong before you start.
Why the ROAS target should differ by campaign
Break-even is the floor. The target for a particular campaign depends on what that campaign is for, and a single account-wide target tends to reward the campaigns doing the least new work.
What is a good ROAS for new versus repeat customers
Retargeting and branded search tend to show the highest ROAS in an account. They reach people who already know the business, some of whom would have bought anyway. Campaigns that find new customers report lower ROAS because the job is harder and the credit arrives later. Hold both to one number and budget drifts toward the campaigns claiming sales you’d have got regardless.
A lower first-order target for new-customer campaigns can make sense when you know, from your own order history, that new customers come back and buy again. A lifetime value figure borrowed from someone’s pitch deck isn’t a reason to run below break-even for six months.
Product mix, clearance and objective
A campaign pushing a 70%-margin accessory and one pushing a 25%-margin appliance need different targets, even in the same store. A campaign clearing end-of-season stock may be fine at a lower return, because the alternative is paying to hold the inventory. And a campaign set up with an awareness objective shouldn’t be judged on ROAS at all. Nobody asked it to produce sales.
Platform ROAS includes credit your store may never see
The revenue in an ad platform’s ROAS is attributed revenue: sales the platform’s attribution settings credit to an ad. It isn’t money in the bank account, and several things pull the two apart:
- Attribution windows: a purchase can be credited to an ad days after the click, or after someone only saw the ad. Meta’s default for website conversions, for example, counts a purchase within seven days of a click or one day of a view, and Meta revises these options from time to time.
- Overlapping credit: Meta ads and Google Ads each apply their own attribution, so both can claim the same order and the platforms added together can exceed what the store took.
- Modeled conversions: where tracking is incomplete, for instance when visitors decline cookies, Google Ads can report conversions it has estimated rather than observed.
- Refunds and cancellations: the purchase is counted when it happens. Unless someone sends the platform a conversion adjustment, a refund two weeks later doesn’t change the reported value.
Take a hypothetical store. For March, Meta claims $30,000 in purchase value and Google Ads claims $22,000. The store’s own records show $38,000 of revenue from every channel, email and direct visits included. The platforms’ combined $52,000 can’t all be true.
So before calling any ROAS good, put the platform figure beside store revenue for the same period and note the attribution window it used. If the tracking itself is in doubt, deal with that first; our guide to broken conversion tracking and what to tell the client covers that conversation while you fix it.
ROAS vs ROI vs profit: three different questions
These three get used interchangeably in meetings, and they answer different questions. ROAS is a revenue ratio, not a profit ratio. It says nothing about what the sales cost to fulfil.
This is how an owner ends up in an awkward call with their accountant. The account spends $10,000 in a month at a reported 4x, so $40,000 of attributed revenue. The owner says the ads ‘make four times what they cost’, and the accountant goes looking for $30,000 of profit.
With the 32.5% contribution margin from earlier, that $40,000 contributes $13,000. Take off the $10,000 of ad spend and a $2,000 management fee and $1,000 is left, before rent, salaries or any overlap in platform credit. ROI on the $12,000 spent is about 8%.
None of that makes 4x a bad result. It means 4x only becomes meaningful with the margin written next to it.
How to explain ROAS to clients with margin context
Clients hear ROAS as a score. Report 3.2x on its own and they’ll compare it with a number a friend mentioned at dinner. Give them the comparison that matters instead. A client-facing ROAS line should carry:
- The ROAS, plus the spend and revenue it came from, both for the same reporting period.
- Where the revenue came from: platform-attributed, store records or both, and the attribution window if it’s platform data.
- The break-even ROAS for this client’s margin, agreed with them before the campaign started.
- What the result means in dollars after the variable costs you both agreed.
- What the figure can’t show, such as whether these sales would have happened anyway.
The break-even does most of the work. ‘ROAS was 3.2x against a break-even of 3.1x’ tells a client the campaign roughly paid for itself and little more. If you don’t know the client’s margin, ask. Some owners have never been asked, and the question changes how they read every report after it.
Keep platform revenue and store revenue separate on the page, and say which one a decision was based on. This is where vanity metrics vs actionable metrics stops being theory: ROAS beside its break-even is something a client can act on, while ROAS alone is decoration. If you write these reports often, a client ad campaign report in Prooflin takes its figures only from the metrics you confirmed, and you edit the explanation around them.
When there’s no revenue to work from
Lead generation and businesses that close deals offline often have no revenue figure that lines up with the ad period. The temptation is to build one: multiply leads by an assumed close rate and an average sale, then call it ROAS. Don’t. A ROAS built on two guesses looks exactly like one built on records, and the client can’t tell which they’re reading.
The honest line is short. ROAS not calculated, because revenue for this period wasn’t supplied. Then say what is known, and what would make the calculation possible next time.
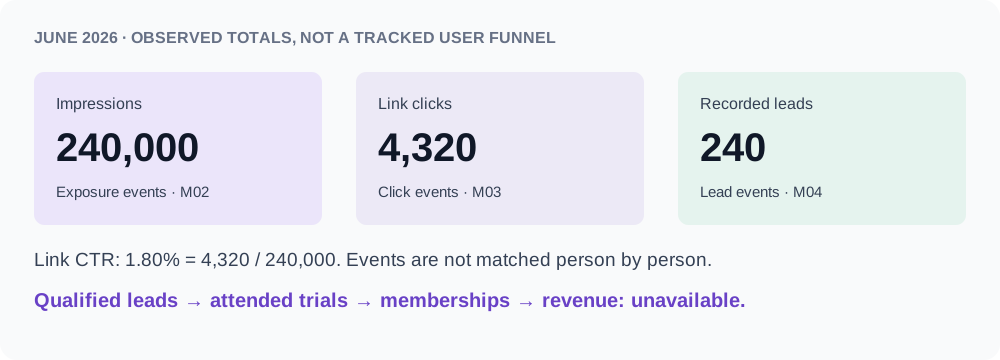
Prooflin’s sample Ad Campaign Performance Audit for that fictional gym, FitForge, shows how this reads. The June 2026 dataset has $4,800 of media spend and 240 recorded lead events, but no revenue, memberships or qualified leads. So the calculation appendix carries a section headed Calculations deliberately unavailable, which states that ROAS needs compatible attributed revenue and that the input doesn’t exist. The $20.00 cost per recorded lead is calculated, because both of its inputs were supplied. Whether those leads were worth $20 is a separate question, covered in lead quality vs cost per lead.
The product works the same way. In a Prooflin ad campaign audit, ROAS needs revenue and spend for the same period. If revenue isn’t supplied, ROAS isn’t calculated and the report says so; it is never estimated. When the store or the client’s CRM does have revenue for the period, you can add it beside the platform exports while you review and confirm the campaign metrics, so the calculation starts from a figure someone has checked.
What to do this week
Before the next ROAS figure goes to a client
- Get the margin for each client or product line after fees, shipping, packaging and returns, and write down the break-even ROAS.
- Find out what the ad platform receives as revenue: order total with tax and shipping, or the product subtotal.
- Put last month’s platform-attributed revenue beside store revenue and note the gap.
- Report prospecting and retargeting separately, with their own targets.
- Wherever revenue is missing, write ‘not calculated’ and the reason instead of an estimate.
Most of this comes down to one conversation about margin, plus the habit of keeping platform credit and store revenue apart on the page.