
Lead quality vs cost per lead: why the cheaper lead costs more
Start by assuming the sales team is right, if not about every lead then about enough of them. A drop from $42 to $19 means more than twice as many leads for the same budget. If the sales team didn’t double and closed deals didn’t move, the extra leads went somewhere, and the people making the calls are telling you where.
Cost per lead is spend divided by recorded lead events, and both halves show up in the ad account within a day. Whether a lead becomes a customer can take a full sales cycle. That gap makes CPL easy to improve and easy to misread. Push it down and the platform gets better at finding people who fill in forms, and they aren’t reliably the people who buy. IntensePath sets out the ways a falling cost per lead drags lead quality down with it, from bidding toward cheap submissions to retiring the ads that quietly filtered out poor fits. This post stays with the other half of the problem: what you put in front of the client.
Take two campaigns on the same $3,000 budget. The figures are illustrative, picked to show the mechanism, not drawn from any benchmark.
Campaign A wins the slide. Campaign B wins the bank account. A $15 lead that closes 2% of the time costs $750 per customer; a $40 lead that closes 20% of the time costs $200. Nobody on the sales team needs that explained to them, which is why they stopped trusting the CPL line.
What cost per lead can and can’t tell you
CPL answers one narrow question: how much media spend did each recorded lead event cost? It can’t say whether the event was a real prospect, a duplicate or someone 80 miles outside the service area. Event is the honest word. Ad platforms count submissions and calls, not people, and certainly not buyers.
Lead quality lives in what happened next. Did someone answer, did they fit, did they buy? Those answers sit with the client’s sales team and their CRM, which is why agency reports so often leave them out. The agency holds the spend; the client holds the outcomes.
That split is why the lead quality vs quantity debate goes in circles. Sales says ‘junk’ after a week of dead numbers, and the agency says ‘cheapest leads ever’ from the dashboard. Both can be accurate. A CPL with nothing beside it turns into a vanity number the moment nobody can connect it to customers. Settling lead quality vs cost per lead starts with one rule: a lead counts as qualified only when it meets a written definition the sales team agreed to before the period was reported.
Agree what qualified means with the people who call the leads
Most junk-lead arguments are really definition arguments. The agency hears ‘qualified’ and thinks ‘filled in every field’. The sales manager means ‘has a project, a budget and a start date this quarter’. Until the word is written down, every report is open to dispute.
For a hypothetical roofing contractor, a workable definition might read: reachable within two attempts, inside the service area, needs a job they actually offer, and expects the work within six months. Four yes-or-no tests that whoever makes the calls can apply without guessing. Getting there takes one short meeting:
- Name one person who applies the definition. When three people qualify leads, the count drifts. One person using the same tests keeps it comparable from month to month.
- Write each test as a yes-or-no question. ‘Good fit’ isn’t a test; ‘inside the service area’ is.
- Give every rejection a reason: unreachable, outside the area, wrong service, no budget, duplicate, spam.
- Agree the cohort and the cutoff. March leads are judged as March leads, and the count is read on an agreed date.
- Keep ‘pending’ as its own status. A lead nobody has reached yet hasn’t failed.
The reasons split the sales team’s complaint into parts. ‘Half never answer’ and ‘half are outside our area’ need different fixes, and the second one is squarely the agency’s. Expect some reasons to point back at the client. If most rejections say ‘unreachable’ and the first call goes out two days after the form, no targeting change will fix that.
Report the leads you can stand behind
Once the definition exists, the report changes shape. Recorded leads, qualified leads and customers become separate lines, each saying where it came from:
- Recorded leads, from the ad platform export, with the conversion event named. This is the count CPL is built on.
- Qualified leads, from the client’s CRM or sales log, counted against the agreed definition, with the date the count was read.
- Customers, from the client’s sales records, for the same cohort and dated the same way.
- Cost per qualified lead next to CPL, never instead of it, so the client can watch both move.
When the client reads ‘Qualified leads: 30 (sales log, read 14 April)’, they know whose number it is. The conversation moves from ‘your leads are junk’ to ‘our log says 30 of 75 met the definition’, which both sides can actually discuss.
Prooflin handles campaign data the same way. During the metric review step, you can type in the qualified-lead and sales counts the client’s team gave you, alongside the lead events read from the ad export. Typed values are marked Manually entered, so the report shows which figures came from the platform files and which came from you. Anything you don’t supply stays ‘Not provided’, nothing is calculated until you confirm the metrics, and Prooflin never estimates lead quality. Deciding which leads qualify stays with the sales team.
Prooflin’s sample Ad Campaign Performance Audit for a fictional gym shows the case where the downstream data is missing entirely: 240 recorded lead events at $20.00 each, and no qualified leads, attendance or memberships. The report doesn’t fill the gap. It raises the gap as a priority 1 finding and says plainly that a cost per qualified lead can’t be calculated:
CPL is visible; lead value is not
Finding
The recorded-lead CPL is USD 20.00, but no count of qualified leads, trial attendance, memberships or revenue accompanies the 240 lead events. A cost-per-qualified-lead or membership CPA cannot be calculated.
Why it matters
Optimizing only for recorded leads can reward a change that increases low-intent or duplicate enquiries. Conversely, a campaign with fewer but more valuable enquiries could look worse on raw CPL alone. The current data cannot distinguish either case.
The client-facing version of the same sample turns that gap into a section called ‘Make lead quality discussable’. The owner agrees what qualifies, one cohort is defined, reception records aggregate counts for reached, pending, qualified and joined, and unmatched or pending records stay visible. No names or phone numbers go in the report.
When the CRM numbers are late or partial
They usually are. A lead that arrived on the 28th may not have had a call by report day. The temptation is to drop the qualified-lead line until it’s complete. Don’t. A missing line looks like a hidden one, and the client will notice it vanished in the month the numbers turned bad. Report the state instead: ‘March cohort: 22 qualified, 12 rejected, 41 pending (sales log, read 3 April).’
How to measure lead quality when sales says it’s junk
Lead quality doesn’t fit in one number, and pretending it does starts a fresh argument. A few measures, read in order, show where leads fall away:
- Contact rate: the share of leads someone actually spoke to. A low rate points at bad details, bots or slow follow-up.
- Qualification rate with reasons: the share that passed the agreed tests, and why the rest failed.
- Next-step rate: quotes sent, appointments or consultations booked.
- Close rate by cohort: customers from that month’s leads, read once the cohort has matured.
State the denominator for every rate, and use the same one each month. The FitForge sample makes the point about its own figures: ‘A low CPL does not prove low membership acquisition cost.’ Its sensitivity chart holds spend at $4,800 and changes only the number of lead events, which is enough to show how far CPL moves without anything being known about quality.
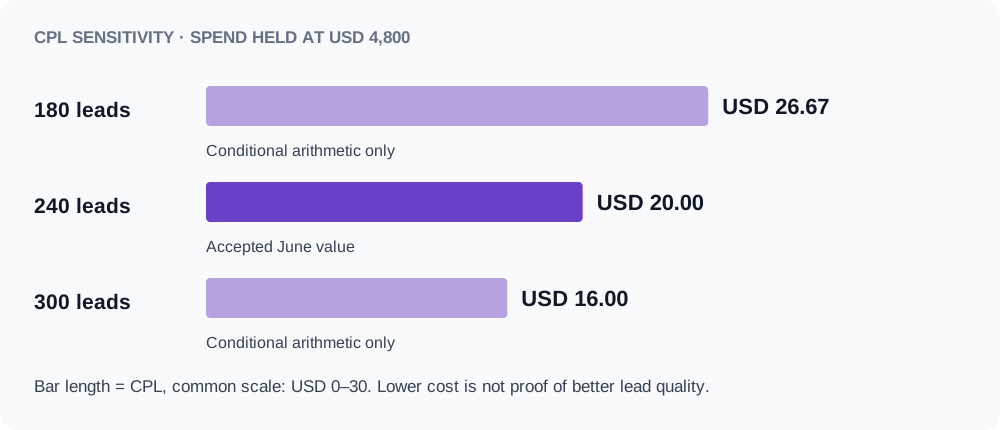
Beside the 300-lead case, the report asks whether the additional events were valid, distinct and useful. Ask that of any CPL drop you’re about to present. If your data can’t answer it, say so, and say what would.
What changes on the campaign side once quality is visible
Once qualified leads sit beside CPL in every report, the campaign gets managed against both:
- The success event moves later. If the client records which leads qualified, judge the campaign on that event and, where the platform supports it, optimize toward it instead of the raw submission.
- Ads start filtering again. Naming the service area, a starting price or the job type puts off the people sales kept rejecting. CPL rises; the rejected share should fall.
- The form asks what sales needs. One or two qualifying fields cost some submissions and save wasted calls.
- Budget stops chasing CPL alone. A cheap source with a high ‘outside the area’ rejection rate needs a targeting fix before it gets more money.
Agree in writing, before any of these changes, that CPL will probably rise. A report showing CPL climbing from $19 back to $31 reads as failure unless the qualified-lead line sits beside it. If the month goes badly anyway, explaining the result without spin is far easier when the client signed off on the measures first.
It’s also the short answer when a client asks what a good cost per lead is: that depends on how many of those leads become customers.
What to do before the next monthly call
Before the call
- Ask the sales team for last month’s outcomes as counts, not names: reached, qualified, rejected with reasons, pending.
- Write the qualified definition down with them and send it back for a yes.
- Confirm which conversion event your CPL is built on, so you know what a ‘lead’ means in the export.
- Add recorded leads, qualified leads and customers as separate lines, each with its source and the date it was read.
- Tell the client CPL may rise when the campaign starts filtering, before it does.
None of this needs new software on the client’s side. It needs one conversation and the habit of dating every number you didn’t produce yourself. If you’d like to see where typed-in outcomes fit in a client campaign report, the FitForge samples show a finished one that never calls 240 lead events anything more than they are.