
Why paid ads reports lead with the wrong numbers
Say a physio clinic spends $3,000 on Meta ads in a month to get appointment requests. The report arrives, and the first slide says 410,000 impressions, 152,000 people reached and a 2.1% click-through rate. All three may be accurate. None of them tells the owner whether the $3,000 bought anything.
Those figures end up on top for understandable reasons. The platform records them whether or not tracking works, and they climb with spend, so they rarely look bad. The figures that matter (booked appointments, sales, usable enquiries) often sit in a system the person writing the report can’t see.
The damage shows up later. The client learns to read the report by its first number, so when reach falls because budget moved to a tighter audience that books more often, they ask why performance dropped.
That’s the real trouble with vanity metrics in digital marketing. They aren’t useless. They’ve just been put in charge.
Vanity metrics vs actionable metrics depend on the objective
Most writing on vanity metrics vs actionable metrics comes from social media or product analytics, and treats certain numbers as permanently vain. Paid ads don’t work that way. The same metric can be either kind, depending on what the campaign was paid to do.
A working definition: a metric is actionable when it measures what the campaign was bought to produce, or when a change in it would change a decision someone is allowed to make. A vanity metric gets reported because it’s big or available, and nobody would act differently if it moved.
Take reach. For an awareness campaign announcing a new location, reach in the right area at a sensible frequency is the result. For a lead generation campaign it’s context: how many people could have enquired, and nothing about whether they did. CTR shifts the same way. On a traffic campaign, link CTR sits close to the outcome. On a sales campaign, a high CTR with no purchases is a warning sign: people like the ad but not the offer, or the page doesn’t keep the ad’s promise.
Vanity metrics examples that are really context
- Impressions on a lead or sales campaign: proof the ads ran, not proof they worked.
- Reach on anything except awareness: the size of the room, not the hands that went up.
- CTR on a lead or sales campaign: a diagnostic for the ad and offer, meaningful only beside the outcome.
- Reactions and shares on a conversion campaign: sometimes useful creative feedback, rarely a reason to keep spending.
- A raw lead count when the client cares about qualified leads: closer, but still one step short.
The objective decides what leads
Once the objective is the test, the order of the report stops being a matter of taste. Write the objective down first, in the client’s words if you can (“appointment requests for the new knee clinic” rather than “conversions”), and let it pick the opening figures.
Vanity metrics vs actionable metrics, objective by objective
Every supporting figure there is legitimate. The problem is a report that opens with one because the real result was harder to get.
Sales campaigns bring their own argument: ROAS leads the report and everyone debates whether 3x is good. That depends on your margin, refunds and repeat purchases rather than somebody else’s average, and the arithmetic is worked through in what a good ROAS looks like for your margin.
A Prooflin ad campaign audit is set up the same way. You choose the platform, the objective (Lead Generation, Sales, Bookings, Traffic or Awareness, for example), one reporting period and, optionally, a currency, and the objective tells the analysis which figures to lead with. Derived figures such as CPL and CPM are calculated only from values you’ve confirmed, and an outcome you didn’t supply stays marked Not provided.
Prooflin’s sample for a fictional gym, FitForge, shows the result. It covers one month of Meta Ads data (June 2026): $4,800 of media spend and 240 recorded lead events at $20.00 each, and those three figures lead the cover. ROAS isn’t calculated, because no revenue was supplied, and recorded leads are kept separate from qualified leads and memberships. You can read the FitForge sample campaign reports in both the internal and the client-facing versions.
Keep the supporting metrics, just don’t let them lead
None of this means deleting CTR, cost per click and CPM. They explain the leading figure: if cost per lead rises and tracking hasn’t changed, a higher CPM points to delivery cost, a lower CTR points to the ad or the offer, and a steady CTR with fewer leads points past the click, toward the page or the form.
The FitForge client report handles this in a section called “The four KPIs, explained”. Link CTR is 1.80% (4,320 link clicks over 240,000 impressions), cost per link click is $1.11, CPM is $20.00 and CPL is $20.00. Each sits beside its exact denominator and a plain line on what it doesn’t mean (CPL, for instance, is not cost per qualified lead or member).
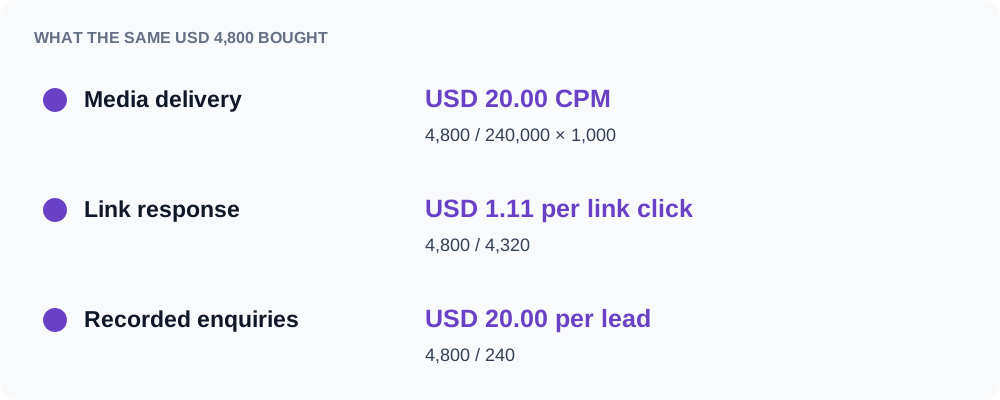
The next section, “One spend total, three cost views”, makes a point plenty of reports miss. These are three ways of dividing the same $4,800, not three expenses. The matching $20.00 for CPM and CPL is a coincidence with different units, and a busy owner shown both without labels will assume they’re the same thing.
A supporting metric earns a place near the top only when it explains a movement in the leading figure, and then it belongs inside that sentence. “Cost per lead went up, mostly because CPM went up” is useful. A standalone CPM tile teaches the client to watch CPM.
Cost per lead has a ceiling of its own. A cheap lead the sales team can’t reach isn’t cheap. When the people closing the work say the leads are junk, the argument is really about definitions and follow-up evidence, which is the subject of lead quality versus cost per lead.
Three errors that make honest numbers misleading
Some figures become vanity metrics through how they were added up or compared, not what they measure.
Reach summed across ads isn’t reach
Reach counts unique people, and unique counts don’t add. Say three ad sets report reach of 40,000, 35,000 and 30,000, and the report announces 105,000 people. Anyone who was in more than one ad set has been counted more than once, and when every ad set targets the same town, that overlap can be large. Use the platform’s figure for the whole campaign and period. Summing daily reach has the same flaw.
In the FitForge sample, reach is one whole-period value of 96,000. Dividing 240,000 impressions by it gives an average of 2.50 exposures per person, exactly the kind of figure that gets read as ad fatigue. The internal audit explains why it shouldn’t be:
Average exposure does not prove fatigue
Finding
The whole-period ratio of 240,000 impressions to 96,000 reached people is 2.50 impressions per reached person. It describes average exposure across the sample period, not how often each person saw an ad.
Recommended response
Keep frequency as a descriptive check. Do not refresh all creative or pause an audience solely because the average is 2.50. If fatigue is suspected, obtain comparable interval and creative-level evidence for a separate review.
One month called a trend
A single month is a baseline. It can’t show improvement or decline, because there’s nothing to measure it against. Even two months need matching definitions, attribution settings and scope before a difference means anything. The FitForge audit gives this its own finding, warning that an unsupported success claim could lead to an unjustified budget increase.
The reverse happens too: one weak month treated as proof the campaign is failing. If you’re the one presenting it, explaining bad campaign results without spin or blame covers what to say and what to leave out.
Definitions never agreed in writing
“Clicks” can mean all clicks, link clicks or landing-page views. A lead can be a website form, an instant form or a phone call. If the definition shifts between exports, the number moves while nothing real has changed. The FitForge audit flags exactly this: a later export that counted all clicks instead of link clicks would show a higher CTR without any real improvement in response. The fix is dull, and it works. Agree in writing what each leading metric counts, the attribution window and where the conversion happens.
What to write when the outcome metric was never supplied
This is where most vanity reporting starts. The outcome isn’t available, so the best proxy gets quietly promoted. Clicks become “traffic”, leads become “new customers”, and nobody records the swap.
The honest version is short. Name the outcome the objective calls for, say it wasn’t supplied, say who holds it and say what it would let you calculate. Then lead with the closest figure you do have, labeled as exactly what it is.
Two rules stop this from sliding back. A missing figure is never zero, and it’s never estimated. Zero memberships and memberships not supplied mean different things to an owner, and “about one in ten leads usually joins” turns a gap into an invented result. The FitForge client report states the position plainly in its summary: enquiry volume is visible, commercial value is not.
Prooflin’s campaign workflow holds to the same rules. You confirm every metric before anything is calculated, and conversions, revenue and ROAS are never estimated. A client-safe campaign report comes out shorter in places as a result, which is the point.
Sometimes the outcome is missing because tracking broke partway through the month. That’s a different conversation with a deadline attached, covered in what to tell the client when conversion tracking breaks.
What to change in this month’s report
You don’t need a new reporting setup to fix the order. Most of it is editing.
- Write the objective at the top in the client’s words, and check that the first figure measures it.
- Move impressions, reach and CTR below the outcome and its cost, each tied to a sentence that explains it.
- Replace any summed reach with the campaign-level figure for the whole period.
- List each missing outcome as Not provided, with the name of whoever holds it.
- Send the client a short note defining a lead (or sale, or booking), the click type and the attribution window, and get it confirmed.
- Describe a single month as a baseline, not as better or worse.
If you write these up for several clients each month, the page for digital marketers shows how Prooflin turns one confirmed dataset into an internal audit, a client report or both.