
Performance audit / 01
FitForge Gym
Meta Ads Campaign
Performance Audit
June 1–30, 2026 · USD
The campaign records enquiries.
The next decision needs lead quality.
Use June as a documented baseline. Resolve outcome visibility and measurement definitions before treating a lower CPL as business success.
Prepared for the marketer or agency responsible for the campaign. This is the complete analytical audit, including sources, calculations and proposed actions.
Authored sample · Version 1.0 · 11 October 2026
Report ID: FITFORGE-PA-2026-06
All campaign values are authored in USD. No real ad account, engine run or live campaign result is represented. The evidence boundary is explained once in detail in the source record.
Performance audit / 02
Executive assessment
June provides a usable cost-and-volume baseline, but it does not establish whether the campaign is acquiring valuable members. USD 4,800 of media spend produced 240 recorded lead events at USD 20.00 each. The accepted click measure is 4,320 link clicks, giving a 1.80% link CTR and USD 1.11 cost per link click. Those calculations are internally consistent; their commercial meaning depends on missing downstream evidence.
| Priority | Why it matters | Recommended response |
|---|---|---|
| 1 · Fix outcome visibility | A lead event is not a qualified prospect or membership. No qualification, attendance or revenue outcomes are supplied. | Agree a lead-quality definition and reconcile campaign leads with a separate customer-owned follow-up log. |
| 2 · Lock measurement meaning | Attribution window, conversion location and timezone are absent. These gaps can make future comparisons misleading. | Record the settings and definitions before using a new period to judge change. |
| 3 · Test within a limit | There is no target CPL, historical comparison or creative-level evidence. June cannot identify a winner to scale. | Keep any further test bounded by an owner-approved ceiling and explicit review criteria. |
The strongest supported statement is descriptive: the sample records 240 lead events at USD 20.00 CPL. “Strong lead quality,” “profitable acquisition,” “fatigued creative” and “best audience” are not supported conclusions.
Do not stop every campaign merely because evidence is incomplete. Stop unsupported scale decisions; continue only activity that the campaign owner can justify within an approved limit.
Evidence: S01, S02; M01–M05; K01–K04. Findings F01–F07 develop the decision basis.
Performance audit / 03
Objective, scope & reading guide
The scenario is FitForge Gym’s Meta Ads lead-generation campaign, intended to capture interest in a trial class or membership consultation. That intent does not establish a free trial, a seven-day offer, a membership price, a service radius or an approved health claim.
| Context | Accepted scope |
|---|---|
| Period | June 1–30, 2026, inclusive, as the supplied reporting label. Timezone is not supplied. |
| Currency | USD throughout. Media spend only; fees, taxes and creative production costs are not supplied. |
| Input | One campaign-period CSV row with five measures and one source-definition/confirmation record. |
| Evidence grain | Whole-period aggregate. No daily, audience, placement, device, ad-set or creative series. |
| Outcomes | Recorded leads only. Qualified leads, appointments, attendance, memberships, revenue and profit remain unavailable. |
| Audience | Marketer / agency analytical review. Recommendations are proposed customer work, not changes to an ad account. |
Read the executive assessment first, then the metrics and evidence-quality pages. Findings connect each observation to an impact, an action and a way to check it. The final pages contain the complete source register, readable source gallery and calculation appendix.
The report uses confirmed to mean accepted for this authored sample after checking its source definition. It does not mean a real customer confirmed a live account inside Prooflin. Confidence separates reproducible arithmetic from uncertain interpretation.
No industry benchmark or performance target is supplied. A numeric result is therefore not labelled “good” or “bad” against an invented threshold.
Performance audit / 04
The accepted metric ledger
These five values are the complete numerical input. Every displayed June KPI and chart traces back to this ledger. The CSV contains a header and one data row; no detail rows, subtotals or duplicate total rows are combined.
| Evidence ID | Measure | Accepted value | Definition |
|---|---|---|---|
| M01 | Media spend | USD 4,800.00 | Campaign media cost; excludes unknown non-media costs. |
| M02 | Impressions | 240,000 | Served impression events; repeated exposures can count. |
| M03 | Link clicks | 4,320 | Link-click events; not all clicks, unique users or sessions. |
| M04 | Recorded leads | 240 | Campaign lead events; quality and person-level deduplication unverified. |
| M05 | Whole-period reach | 96,000 | One whole-period unique-reach value; never summed across rows. |
All values use the same campaign-period scope from S02. Spend is denominated in USD; counts are events or reached people as defined above. No zero has been inserted for an absent outcome.
Reach is supplied once for the whole period. Summing daily or ad-set reach would count people again when audiences overlap and is not a valid way to reproduce M05.
For source inspection, use the complete source gallery or download the frozen CSV. The readable source record contains the definitions and confirmation decisions.
Evidence: S01 row 2, columns 1–5; S02 accepted values and C01–C07. Arithmetic reliability: high within this fixed dataset. Real-world accuracy: not asserted.
Performance audit / 05
Cost, response & volume
Four cost and response measures follow directly from the accepted base metrics. Ratios are calculated from totals, never by averaging previously rounded row-level ratios.
| KPI | Calculation | Display | Interpretation |
|---|---|---|---|
| K01 · Link CTR | 4,320 ÷ 240,000 × 100 | 1.80% | Link-click events per 100 impressions. |
| K02 · Cost per link click | USD 4,800 ÷ 4,320 | USD 1.11 | Media cost per link-click event, rounded. |
| K03 · CPM | USD 4,800 ÷ 240,000 × 1,000 | USD 20.00 | Media cost per 1,000 impressions. |
| K04 · CPL | USD 4,800 ÷ 240 | USD 20.00 | Media cost per recorded lead event. |
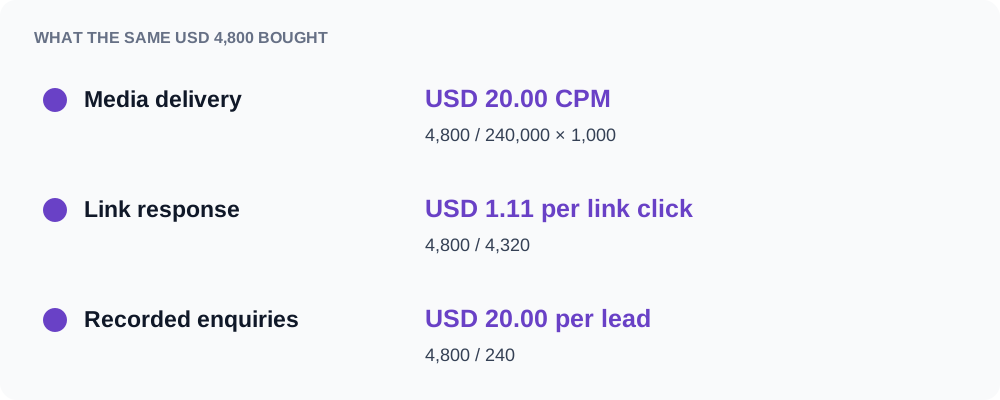
A low cost per click does not prove strong lead quality. A low CPL does not prove low membership acquisition cost. The required denominator changes at every stage.
Performance audit / 06
What the event counts tell us
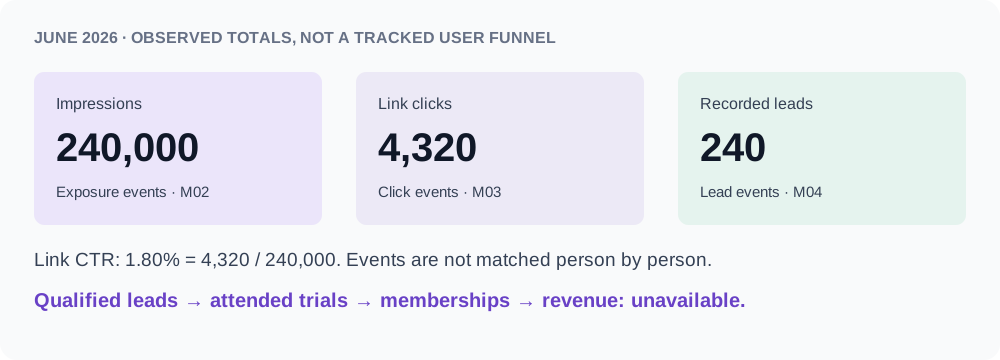
The three event totals are useful together, but they do not prove that the same people moved through every step. A person can generate more than one impression or click. The lead attribution window is unknown, and no click-to-lead matching data is supplied.
| Safe reading | Unsafe reading |
|---|---|
| 1.80 link clicks are recorded per 100 impressions. | 1.80% of unique people visited the website. |
| There are 240 recorded lead events during the stated reporting scope. | 240 distinct, qualified prospects or new members were acquired. |
| June lead events divided by June link clicks is a descriptive quotient. | The quotient is a verified website conversion rate. |
Landing-page views and sessions are not supplied, so a post-click website drop-off cannot be located. Form opens, form completions and conversion location are also absent. The report cannot distinguish destination friction from low-intent demand, duplicate events or attribution timing.
Before changing a form or landing page on this evidence, first establish which conversion location and event definition produced the leads. Then inspect the relevant customer journey.
Performance audit / 07
Data quality & reconciliation
The dataset is arithmetically coherent and deliberately narrow. That combination supports an honest baseline, while limiting causal and commercial conclusions.
| Check | Result | What remains |
|---|---|---|
| Scope consistency | Five values, one row, one USD period. No subtotal overlap. | Timezone and attribution window need confirmation for comparisons. |
| Click definition | “Link clicks” accepted as the single click measure. | Do not substitute all clicks or sessions. |
| Source conflict | No conflicting accepted source or numeric correction. | A new file can change scope or meaning; review it again. |
| Derived ratios | Recomputed from base totals; no averaged CTR/CPL. | Rounding is display-only. |
| Reach | One whole-period value; no cross-row sum. | Exposure distribution and subgroup overlap unavailable. |
| Business outcomes | Clearly unavailable, not zero. | Lead qualification, appointments, memberships and revenue required. |
The excluded material is as important as the accepted material: unrelated datasets, proposed creative winners and claimed screenshot extraction confidence are not evidence for this audit. No screenshot or OCR output is used.
Keep the source file, definitions and report together. A familiar column label can still carry a different meaning after an export changes. Confirm the denominator before comparing ratios.
Evidence: S01; S02 C01–C07. There is no claim of live verification, extraction confidence, or statistical representativeness.
F01 · Evidence-linked finding / 08
Keep the June baseline intact
The five accepted values reproduce all four core KPIs without a numerical correction: 1.80% link CTR, USD 1.11 cost per link click, USD 20.00 CPM and USD 20.00 CPL. This is a workable baseline for a later like-for-like review.
Why it matters
A stable denominator prevents an apparent improvement from being caused by switching from link clicks to all clicks, or from recorded leads to qualified leads. Preserving the original baseline also makes later corrections explainable.
Recommended response
Archive this CSV and S02 as a matched pair. Keep metric labels, period, currency and calculation rules alongside any later report. If a definition changes, mark a break in comparability rather than overwriting June.
How to check it
Re-enter USD 4,800, 240,000 impressions, 4,320 link clicks and 240 leads into an independent calculator. Confirm the four KPI results on the calculation appendix. Verify the CSV hash against the source register.
Confidence: High for arithmetic and internal consistency of the supplied sample. This is not confidence in a real platform export.
Limit: Consistency does not validate the underlying campaign, lead quality or profitability. One aggregate period cannot establish a trend.
F02 · Evidence-linked finding / 09
CPL is visible; lead value is not
The recorded-lead CPL is USD 20.00, but no count of qualified leads, trial attendance, memberships or revenue accompanies the 240 lead events. A cost-per-qualified-lead or membership CPA cannot be calculated.
Why it matters
Optimizing only for recorded leads can reward a change that increases low-intent or duplicate enquiries. Conversely, a campaign with fewer but more valuable enquiries could look worse on raw CPL alone. The current data cannot distinguish either case.
Recommended response
Agree what counts as a valid enquiry and a qualified prospect with the gym operator. Reconcile lead records with a customer-owned follow-up log, recording contactability, qualification and eventual appointment outcomes. Keep personal contact details outside the public report.
How to check it
Choose a documented campaign cohort and follow-up cutoff. Reconcile total source leads with matched, unmatched, duplicate and pending records. Review the definition and denominator before calculating a qualified-lead cost. Unknown records must remain unknown.
Confidence: High that the necessary outcome inputs are absent. Low for any claim about the actual quality of these leads.
Limit: Do not label all 240 leads unqualified, lost or worthless. Missing results are not failed results, and later outcomes may mature after the reporting period.
F03 · Evidence-linked finding / 10
Protect the click denominator
The accepted source measure is 4,320 link clicks. It produces a 1.80% link CTR. The word “clicks” on its own is insufficient to establish whether a future source uses the same definition.
Why it matters
If a later period includes all clicks while June uses link clicks, a higher apparent CTR may simply reflect a broader event count. The same mismatch would lower cost per click without showing a true improvement in link response.
Recommended response
Keep “link clicks” in the customer-facing metric name and export instructions. Ask the campaign operator to document the exact selected column and ensure that every compared period uses it. Do not replace missing sessions with clicks.
How to check it
Compare the original column headings and source definition record before accepting a new file. Recalculate CTR as accepted link clicks divided by accepted impressions. Check that the numerator has not become unique clicks, all clicks or destination views.
Confidence: High about the accepted definition and calculation. The possibility of a future mapping error is a risk to prevent, not an observed account defect.
Limit: The current CSV is not ambiguous: its header says “Link clicks.” There is no evidence that the actual campaign used a wrong denominator.
F04 · Evidence-linked finding / 11
Resolve attribution before comparison
S02 does not supply an attribution window, reporting timezone or conversion location. The report therefore preserves 240 recorded leads without claiming when those people clicked, where the conversion occurred or how an ad received credit.
Why it matters
A change in attribution settings or cutoff can change reported leads even when customer behaviour is unchanged. A same-calendar-month click total and lead total are not necessarily a matched acquisition cohort.
Recommended response
Record the operator-confirmed attribution window, reporting timezone, conversion event and location with the next source set. If June’s definition cannot be recovered, use June as a descriptive baseline with a clear comparability caveat.
How to check it
Verify both periods use compatible definitions and account/report filters. Record late-arriving outcomes separately. Reconcile event-time and reporting-time conventions before treating a difference as improvement.
Confidence: High that these definitions are missing. No confidence is claimed in any particular attribution model or window.
Limit: Do not assume a common platform default, a seven-day window, last-click credit, a website form or an instant form. No live settings were inspected.
F05 · Evidence-linked finding / 12
Average exposure does not prove fatigue
The whole-period ratio of 240,000 impressions to 96,000 reached people is 2.50 impressions per reached person. It describes average exposure across the sample period, not how often each person saw an ad.
Why it matters
An average can hide concentration: some people may receive more exposures than others. Without time-series, creative and audience evidence, it cannot establish saturation, annoyance or a declining response.
Recommended response
Keep frequency as a descriptive check. Do not refresh all creative or pause an audience solely because the average is 2.50. If fatigue is suspected, obtain comparable interval and creative-level evidence for a separate review.
How to check it
Ask for non-overlapping time intervals with compatible definitions and creative identities, then review exposure and response together. Keep period-level reach independently deduplicated; never construct it by summing interval reach.
Confidence: High for the 2.50 arithmetic within the accepted source. Not assessable for fatigue, audience saturation or optimal exposure.
Limit: No exposure distribution, creative age, daily CTR or audience breakdown is supplied. This report identifies no tired creative or overexposed segment.
F06 · Evidence-linked finding / 13
One period cannot show improvement
Only June 2026 is supplied. There is no comparable prior period, planned target or approved business threshold for CPL, CTR or lead volume. The report cannot call June improved, declining or above target.
Why it matters
A raw count can look encouraging without showing what changed, how much was spent previously or whether the business can handle and value the enquiries. An unsupported success claim could lead to an unjustified budget increase.
Recommended response
Use June to establish a fixed reporting baseline. Agree which business outcome will determine success and what comparable source scope is needed next. Keep target-setting separate from describing historical results.
How to check it
When the next period is available, align duration, definitions, currency, campaign scope and attribution. Show spend and lead totals alongside CPL so that a ratio does not conceal a large change in volume.
Confidence: High that comparative evidence and targets are absent. No external benchmark has been applied.
Limit: A same-length month is not automatically comparable; promotions, seasonality and operating capacity may differ. A later comparison still does not by itself establish causality.
F07 · Evidence-linked finding / 14
There is no supported winner to scale
The accepted dataset is one campaign total. It contains no ad-set, audience, placement or creative rows and no ad images. Nothing in the evidence identifies which part of the campaign produced a particular share of spend or leads.
Why it matters
Moving budget to an assumed winner can reduce useful learning or concentrate spend on a segment whose lead quality is unknown. A whole-campaign CPL cannot rank the parts of that campaign.
Recommended response
Do not recommend an allocation percentage or name a winning creative from this audit. If a test proceeds, define the hypothesis and evidence required in advance, obtain the missing supporting records and secure a human-approved spending ceiling.
How to check it
Require consistent identifiers and mutually understood scope for any future breakdown. Reconcile additive totals back to the campaign summary. Review lead quality and uncertainty alongside cost before making an allocation decision.
Confidence: High that no winner can be identified from the supplied aggregate. No claim is made that any audience or creative underperforms.
Limit: This audit is not a creative visual review. There is no observed winning headline, design, placement or audience, and no automatic budget action.
Performance audit / 15
Stop / Continue / Test / Scale / Fix
These are manual decision recommendations for the campaign owner. They do not pause ads, move budget, edit copy or change account settings.
| Decision | Guidance now | Condition / review gate |
|---|---|---|
| Stop | Stop using raw CPL as proof of profitability or as a standalone reason to scale. | Resume a value-based claim only after attributable outcome evidence exists. |
| Continue | Preserve the June source definitions and inspect any approved ongoing activity. | The owner must confirm a spending limit and ability to follow up leads. |
| Test | Test one clear enquiry-message hypothesis after the measurement definition is fixed. | Hold other material variables stable where practical; predefine the decision criteria. |
| Scale | No scale recommendation is supported by this source set. | Require consistent measurement, acceptable lead quality, business economics and an approved ceiling. |
| Fix | Resolve attribution/context gaps and downstream lead follow-up. | Name an owner and record the evidence that will close each gap. |
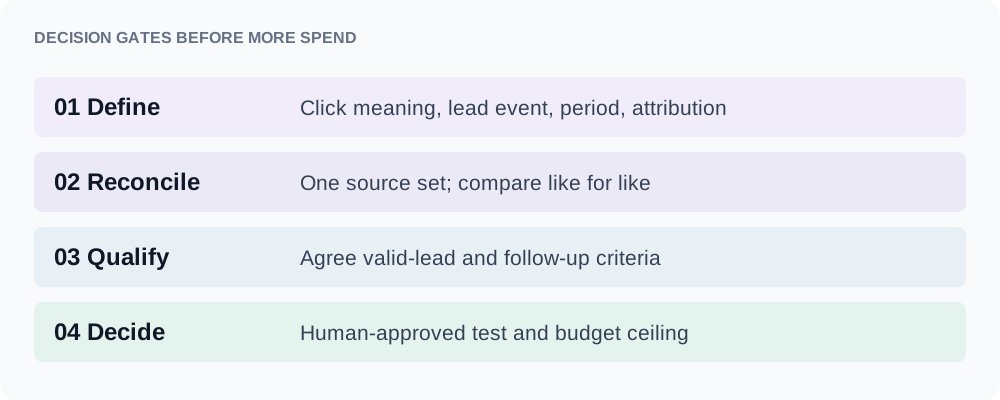
A hold on scaling is not an instruction to shut down the whole account. The owner must consider actual operating constraints and information outside this sample.
Performance audit / 16
CPL sensitivity & its limits
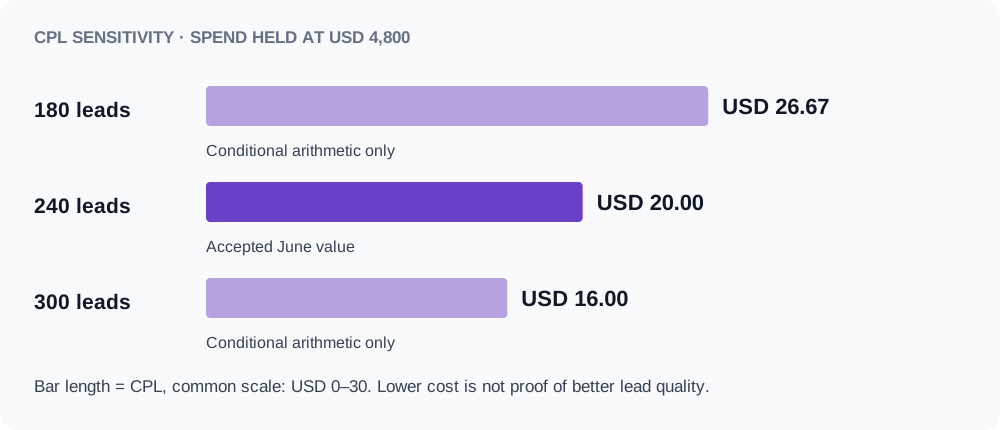
CPL is spend divided by recorded leads. The following arithmetic holds spend constant at USD 4,800 and changes only the number of recorded lead events. It is a sensitivity illustration, not a prediction of extra leads or a promised improvement.
| Case | Arithmetic | What still must be checked |
|---|---|---|
| 180 lead events | USD 4,800 ÷ 180 = USD 26.67 | Were leads better qualified, or simply fewer? |
| 240 lead events · June | USD 4,800 ÷ 240 = USD 20.00 | Quality and business value are unknown. |
| 300 lead events | USD 4,800 ÷ 300 = USD 16.00 | Were additional events valid, distinct and useful? |
A cheaper lead event can still be a more expensive membership if qualification or attendance worsens. This chart cannot estimate membership CPA, ROAS, profit or the budget needed to reach a future lead count.
Evidence: M01/M04 for the observed case; explicit assumed denominators for the other cases. Values are not benchmark thresholds or operating targets.
Performance audit / 17
A useful next test, with explicit limits
The objective names two forms of interest: a trial class and a membership consultation. A practical hypothesis is that clearer enquiry intent may change both recorded lead volume and the usefulness of follow-up. No existing creative or copy was supplied, so these are proposed message directions, not corrections to an observed ad.
| Proposed direction | Example wording | Evidence to collect |
|---|---|---|
| Trial-class intent | “Interested in a FitForge trial class?” CTA idea: “Ask about a trial class.” | Recorded leads, agreed valid-lead criteria and interest category. |
| Consultation intent | “Explore membership options at FitForge.” CTA idea: “Request a membership consultation.” | The same measures, plus whether the enquiry matches the offer actually available. |
The gym must approve offer availability, booking process and exact wording before use. Do not add “free,” a trial duration, a discount, a transformation claim, a testimonial or scarcity that the source does not substantiate.
Design the comparison before launch
- Change one main message variable. Document unavoidable changes to delivery, audience or destination.
- Use consistent event definitions and attribution. Pre-agree the test window, budget ceiling and when pending outcomes will be reviewed.
- Choose a primary business-relevant outcome once it is measurable; retain recorded-lead CPL as a supporting metric.
- Do not declare a winner from an early small difference or from aggregate June data. If the evidence is inconclusive, report that outcome.
Owner: campaign marketer with gym operator approval. No test has been run, no sample-size adequacy is established and no uplift is promised.
Performance audit / 18
The first seven working days
This is a proposed sequence after the owner receives the audit. Days are relative to starting the work, not a claim that actions took place in June.
| When / owner | Action | Completion evidence |
|---|---|---|
| Days 1–2 · Marketer | Lock source scope, link-click definition, conversion event, attribution window and timezone. | A completed source-definition record, plus retained original files and an explicit list of unresolved fields. |
| Days 2–3 · Gym operator | Define a valid enquiry, qualified interest and follow-up outcome. Agree who records them. | A simple shared definition and a customer-owned log; no personal data in the public report. |
| Days 3–4 · Marketer + operator | Reconcile source leads with follow-up records and distinguish unmatched, duplicate and pending outcomes. | A count reconciliation with documented cutoffs; unresolved records remain visible. |
| Days 4–5 · Marketer | Approve one test hypothesis, review conditions and spending ceiling. | Written test plan and approval; no assumed budget amount from this report. |
| Days 6–7 · Marketer | Review measurement completeness and decide whether the test is ready. | Go / revise / hold decision with reasons and evidence links. |
If attribution or lead definitions remain unresolved, continue fixing measurement. Do not compress the sequence by treating missing outcomes as zero or by declaring a winner before data matures.
Expected benefit: a clearer decision process and reproducible measurement. No numerical performance gain is forecast. Findings F02–F04 and F07 are the immediate dependencies.
Performance audit / 19
The next reporting cycle
Use a full follow-up cycle to distinguish measurement improvement from campaign performance change. The sequence below is proposed work; it is not a reporting automation feature.
| Stage | Work | Review question |
|---|---|---|
| Week 1 · Definition | Complete the first-week actions and retain the accepted June baseline. | Can another reviewer reproduce the metric meanings and totals? |
| Week 2 · Controlled observation | If approved, run the defined test within the agreed limit. Log material campaign and operational changes. | Are both alternatives measured consistently, and are lead outcomes being recorded? |
| Week 3 · Follow-up | Review contactability, qualification and pending outcomes using the agreed cohort and cutoff. | Does any lower CPL come with weaker lead usefulness or incomplete follow-up? |
| Week 4 · Decision | Compare compatible totals and outcomes; document uncertainty and the business owner’s decision. | Continue, revise, stop or cautiously expand—and what evidence justifies it? |
What the next review should contain
- The original and revised source definitions, including a visible record of changes.
- Additive totals and compatible denominator definitions for each reviewed scope.
- A separately reconciled follow-up outcome summary with pending and unmatched records.
- A statement of what is comparable to June and what is not.
- The test hypothesis, actual operating changes, decision and limitations.
No daily trend or month-over-month percentage is shown here because no time series or second period exists. A complete cycle may still be inconclusive; reporting that uncertainty is a useful result.
Performance audit / 20
Measurement handoff checklist
Use this checklist with the campaign operator before the next analysis. It describes information to collect and review; it does not imply a native CRM connection or automatic campaign management.
| Area | Confirm | Why it matters |
|---|---|---|
| Source scope | Campaign scope, filters, inclusive period and reporting timezone. | Prevents combining unlike totals or shifting date cutoffs. |
| Clicks | Exact link-click column; no substitution with all clicks or sessions. | Protects CTR and cost-per-click meaning. |
| Lead event | Conversion location, event definition, attribution window and duplicates policy. | Clarifies what a recorded lead represents. |
| Costs | Media spend currency and treatment of taxes, fees and production. | Keeps media CPL distinct from total acquisition cost. |
| Follow-up | Valid/qualified definition, matching method, cohort, cutoff and pending outcomes. | Allows useful downstream interpretation without guessing. |
| Comparisons | Compatible period, scope and material operating changes. | Avoids false trend or test conclusions. |
| Decision | Business outcome, review criteria, budget ceiling and named approver. | Makes a recommendation reviewable before execution. |
Retain exact settings privately with the business. Public reporting should use aggregate counts and definitions; it does not need prospect names, phone numbers, emails or account credentials.
Minimum handoff: one source set, one definition record, one calculation sheet and one unresolved-data list. More files are useful only if their scopes reconcile.
Performance audit / 21
Evidence register & source custody
There are two deliberately published source files. Together they contain the entire accepted numerical source and its definitions. There are no hidden campaign files supporting stronger conclusions.
| ID | Source | Supports |
|---|---|---|
| S01 | Frozen June USD CSV Header + one data row, five columns. | M01–M05 and ordinary derived calculations. No account IDs, formulas or personal data. |
| S02 | Source definition & confirmation record Readable UTF-8 text. | Origin, objective, period, currency, definitions, C01–C07 decisions and missing-data boundaries. |
The source gallery provides readable previews of both files. Previewed tables are reconstructed from these sources and are not screenshots of Meta Ads Manager. Charts are presentation derivatives; they do not count as independent evidence.
SHA-256 source identities
S01 · CSVed9ac95aef4fbc63a52ecb3654c52484ea05edd912eb8c05b2bfc612b372ff45
S02 · Definition record7210e53e935b390893008849d5fd6fa5dea84648b3e872f92d66ec23fff5e721
A matching hash proves that the file bytes match this version, not that a real campaign occurred. Changed inputs require a new review and a clear version boundary.
Performance audit / 22
Source gallery · accepted CSV
S01 · FitForge-June-2026-USD-confirmed-metrics.csv
| Spend | Impressions | Link clicks | Leads | Reach |
|---|---|---|---|---|
| 4800 | 240000 | 4320 | 240 | 96000 |
The table above reproduces the complete data row. Spend is USD; count definitions and reporting context are in S02. The plain CSV is intentionally small: it contains no ad-set, creative, date-breakdown or total-summary duplication.
Row-to-evidence map
| CSV coordinate | Evidence ID | Meaning |
|---|---|---|
| Row 2, column 1 | M01 | USD 4,800 media spend |
| Row 2, column 2 | M02 | 240,000 impression events |
| Row 2, column 3 | M03 | 4,320 link-click events |
| Row 2, column 4 | M04 | 240 recorded lead events |
| Row 2, column 5 | M05 | 96,000 whole-period reached people |
There is no numeric correction in this version. Source review accepts the literal values and fixes their meaning. Rounding belongs to the KPI presentation and does not change these base values.
Download S01 CSV · View source gallery
Origin: authored sample data. This is a faithful readable table preview, not an Ads Manager screen capture.
Performance audit / 23
Source gallery · confirmation decisions
S02 defines how the five values may be used. The complete downloadable record includes origin, campaign context, all metric definitions, these decisions, calculation rules and limitations.
| Decision | Recorded outcome |
|---|---|
| C01 | Accept the single CSV row and the five definitions for the sample. |
| C02 | Keep Link clicks as the only clicks denominator; no all-click substitute. |
| C03 | Do not enter Leads as Conversions or Purchases. Those outcomes are unknown. |
| C04 | Accept Reach once at whole-period level; no summed-reach calculation. |
| C05 | Numerical corrections: none. The frozen row reconciles unchanged. |
| C06 | Exclude unrelated datasets, creative/ad-set winners and unverified screenshot/OCR evidence. |
| C07 | Changed source, period, currency or definition requires a new confirmation. |
No extraction defect has been invented to make the sample look realistic. The useful review issues are semantic and evidential: the meaning of clicks and leads, the non-additive nature of reach, and the absence of attribution and downstream outcomes.
The source-confirmation record is authored evidence for this sample. It is not an application audit log or a claim that an authenticated user completed a live review workflow.
Download the complete S02 source record · Read it in the gallery
Performance audit / 24
Calculation appendix
Use the unrounded base values for every calculation. Display rounding is to two decimal places for USD amounts and percentage/frequency presentation. No missing value is replaced with zero.
| ID / measure | Ordinary calculation | Result |
|---|---|---|
| K01 · Link CTR | 4,320 / 240,000 = 0.018 0.018 × 100 | 1.80% |
| K02 · Cost per link click | USD 4,800 / 4,320 | USD 1.111111… → USD 1.11 |
| K03 · CPM | USD 4,800 / 240,000 × 1,000 | USD 20.00 |
| K04 · CPL | USD 4,800 / 240 | USD 20.00 |
| K05 · Average frequency | 240,000 / 96,000 | 2.50 impressions per reached person |
K01–K04 are standard cost/response calculations. K05 is a separately explained aggregate ratio. It is not an individual exposure count, fatigue score or performance threshold.
A tempting but limited quotient
240 leads ÷ 4,320 link clicks × 100 = 5.56% after rounding. This is only a same-period lead-to-link-click quotient. It is not a verified conversion rate: conversion location, attribution window, matched users and compatible cohorts are unavailable. It is not used to score performance or diagnose a website.
Calculations deliberately unavailable
Membership CPA needs confirmed memberships; ROAS needs compatible attributed revenue; total acquisition cost needs costs beyond media; qualified-lead cost needs a defined, reconciled qualified-lead denominator. None of those inputs exists here.
Sensitivity cases: USD 4,800 / 180 = USD 26.67; / 240 = USD 20.00; / 300 = USD 16.00. The 180 and 300 cases are assumptions, not extra observed source rows.
Performance audit / 25
Findings-to-action traceability
Use this register to challenge a conclusion or check that an action has enough evidence. The recommendation remains conditional until its stated requirement is met.
| Finding | Evidence | Proposed response / completion check |
|---|---|---|
| F01 · Baseline | S01/S02; K01–K04 | Preserve the files and definitions; independently reproduce the KPIs. |
| F02 · Lead value missing | S02; M01/M04 | Agree qualification and reconcile a follow-up cohort, including pending and unmatched. |
| F03 · Click meaning | S01 column 3; C02 | Keep the exact link-click definition in future exports and reports. |
| F04 · Attribution missing | S02 context | Document attribution, timezone and conversion location before comparing. |
| F05 · Exposure interpretation | M02/M05; K05 | Use 2.50 descriptively; seek compatible detail before diagnosing fatigue. |
| F06 · No comparison | S01 single period; S02 | Align a later scope and define a business threshold before judging change. |
| F07 · No winner | S01 aggregate; S02 exclusions | Require reconciled supporting evidence and owner approval before allocation changes. |
The action sequence prioritizes evidence gaps that can change a spending decision. It does not assign a proprietary health score, rank unseen audiences or claim a measured uplift.
If a future source contradicts this report, preserve both versions, identify the changed value or definition, and revise the affected finding. Do not silently rewrite the baseline.
Performance audit / 26
Methodology & material limitations
This audit starts with a deliberately authored, inspectable source set. It checks scope and definitions, calculates ordinary KPIs from accepted totals, distinguishes observed evidence from missing outcomes, and develops conditional recommendations. It contains no real campaign performance claim.
- No live Meta account, API connection, account screenshot or platform endorsement. No campaign execution or engine invocation is represented.
- No ad images, landing page, audience or placement evidence. No creative quality judgment, creative winner, audience ranking or daily trend.
- No attribution window, conversion location, reporting timezone, comparable prior period, business target or approved spending ceiling.
- No verified distinct leads, qualification, attendance, memberships, revenue, profit, ROAS or membership CPA. Missing outcomes stay unavailable.
- Proposed copy and tests require review of the actual offer and account context. They are not measured winners, automatic copy replacement or promised results.
- Charts display the frozen source or clearly stated arithmetic assumptions. They are explanatory presentation, not additional measurements.
High confidence in an arithmetic result means another reviewer can reproduce it from the accepted values. It does not establish real-world source accuracy, statistical significance, commercial success or causal attribution.
The useful next decision is to improve evidence before increasing certainty: confirm definitions, reconcile lead outcomes, then choose a bounded test or spending decision.
FITFORGE-PA-2026-06 · Version 1.0 · 11 October 2026
Complete report, full source record and CSV are included in this public package.